

A meter that already records power every 15 minutes has been quietly writing a diary of your building, about 35,000 entries a year. Most companies use it only to calculate the bill, then forget it. Those measurements tell a story about how your building actually operates. They reveal what happened at 3 a.m., whether equipment shuts down at weekends, and whether a reduction in energy use reflects genuine efficiency improvements or simply a warmer winter. The meter accurately records what you consumed. It cannot tell you why consumption has changed. Understanding that difference is where better energy management begins.
The data you already have
In Germany, facilities consuming more than 100,000 kWh of electricity per year are typically equipped with registrierende Leistungsmessung (RLM – Recording Load Profile Measurement), which records average power demand every 15 minutes. This load profile (Lastgang) can usually be downloaded as a simple CSV file from your supplier or network operator. Even smaller facilities are increasingly gaining access to interval data as smart meters are rolled out nationwide. The important point is this: you probably don't need new hardware, sensors or software to start identifying energy waste. The information already exists, you simply need to analyse it. Research has shown that 15-minute interval data alone can reveal how a commercial building operates, often without requiring an on-site audit.
Four warning signs your monthly electricity bill will never show
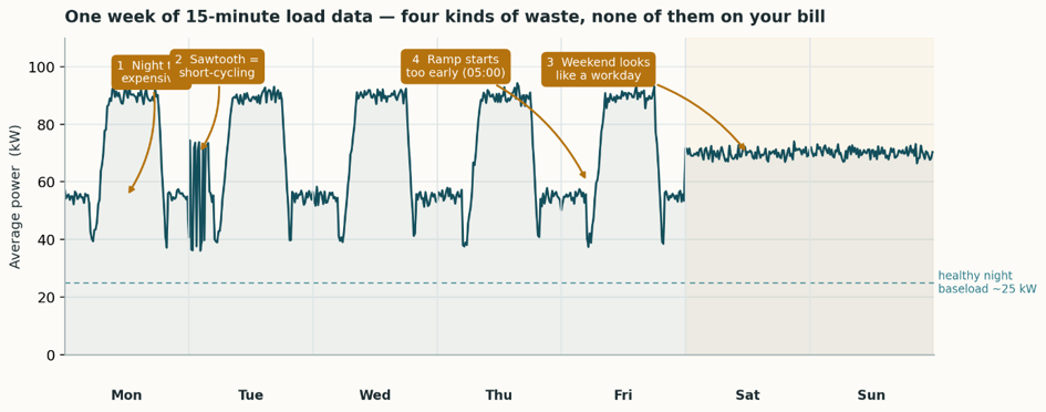
Monthly energy bills tell you how much electricity you used. They don't tell you when or why. Load profiles reveal patterns that often indicate hidden energy waste.
- The expensive night. If electricity demand remains high long after everyone has gone home, something is running unnecessarily. Detailed building audits have found that more than half of electricity consumption can occur outside normal working hours because lighting, ventilation, heating or equipment continues operating when it isn't needed.
- The night-time sawtooth. Repeated spikes during the night often indicate equipment constantly switching on and off instead of operating efficiently. These cycling patterns are almost impossible to detect from monthly bills but become obvious in 15-minute data.
- When weekends look like Tuesdays. A building that is closed at weekends should have a very different load profile from a normal weekday. If Sunday looks almost identical to Wednesday, investigate what is still operating. In one documented case, an entire air-conditioning system ran seven days a week simply to cool one occupied room.
- The drifted schedule. Buildings change. Working hours change. Tenants change. Unfortunately, control schedules often don't. Equipment programmed years ago may still start at 5:30 a.m. even though staff now arrive at 7:00 a.m., wasting energy every single day.
A simple example with a big impact
Imagine an office building with a night-time demand of 62 kW. After investigating the load profile, the facilities team determines that only 25 kW is actually needed overnight. That unexplained 37 kW runs for roughly 5,000 hours each year, consuming approximately 185,000 kWh of unnecessary electricity. At €0.25 per kWh, that represents around €46,000 in annual energy costs often eliminated simply by adjusting operating schedules. Sometimes the cheapest energy-saving project isn't new equipment. It's changing a timer.
Four ways to review your own load profile
You don't need advanced analytics to get started. A spreadsheet is enough for an initial assessment.
- Download one year of 15-minute interval data from your supplier or metering operator.
- Plot one representative week with time on the horizontal axis and power demand on the vertical axis. Measure the average load between 1:00 and 4:00 a.m. Can every kilowatt be explained?
- Compare a Sunday with a Wednesday. Similar profiles often indicate unnecessary operation.
- Compare equipment schedules with actual occupancy. Many savings come from simply aligning controls with reality.
Does this require artificial intelligence?
Not necessarily. The four waste signatures described above are usually visible on a simple graph, and traditional degree-day models often provide an excellent baseline for many buildings. Artificial intelligence becomes valuable when facilities have complex operating schedules, highly variable loads or large volumes of high-frequency data where anomalies need to be detected immediately rather than months later. The goal is not to build the most sophisticated model. The goal is to make better decisions.
Every 15-minute meter already tells a story. The organisations that save the most energy aren't collecting more data, they're paying attention to the data they already have. Your next energy-saving project may already be sitting in a CSV file.
References
- Efficiency Valuation Organization (EVO). (2022). International Performance Measurement and Verification Protocol: Core Concepts (EVO 10000-1:2022). IPMVP overview
- Kuivjõgi, H., Vasman, S., Petlenkov, E., Thalfeldt, M., & Kurnitski, J. (2024). Data-driven baseline generation for post-retrofit energy saving assessment: A comparison of statistical and machine-learning methods. Journal of Building Engineering, 98, 111016. DOI record
- Masoso, O. T., & Grobler, L. J. (2010). The dark side of occupants’ behaviour on building energy use. Energy and Buildings, 42(2), 173–177.
- Netze BW GmbH. (2026). RLM-Zähler: Registrierende Leistungsmessung. Accessed 18 July 2026. Netze BW RLM guide
- Pickering, E. M., Hossain, M. A., Mousseau, J. P., Swanson, R. A., French, R. H., & Abramson, A. R. (2017). A cross-sectional study of the temporal evolution of electricity consumption of six commercial buildings. PLoS ONE, 12(10), e0187129. DOI record
- Umweltbundesamt (UBA). (2021). Element 5: Energieleistungskennzahlen (EnPI) und energetische Ausgangsbasis (EnB). Accessed 18 July 2026. UBA guidance
- Touzani, S., Granderson, J., Jump, D., & Rebello, D. (2019). Evaluation of methods to assess the uncertainty in estimated energy savings. Energy and Buildings, 193, 216–225. DOI record